Early on I realized I needed to qualify some of the snowfall quantity data by reviewing snow quality, since this has a major effect on snow coverage and skiability of big dumps as well as subsequent surface conditions. The Westwide Network data sheets showed water precipitation as well as snow from 1979 to 1995. I selected 8 western areas plus more extensive independent data from Mammoth and Mt. Washington, the highest mountain in the Northeast, and calculated air temperatures for 50-90 months of data, shown here:
|
Area |
|
December |
|
January |
|
February |
|
March |
|
|
|
|
High |
Low |
High |
Low |
High |
Low |
High |
Low |
|
Alpine Meadows |
|
35.4 |
22.9 |
36.6 |
22.5 |
37.7 |
23.2 |
39.5 |
24.2 |
|
Mammoth |
|
33.8 |
18.4 |
33.8 |
17.9 |
32.6 |
19.5 |
34.6 |
21.5 |
|
Mt. Hood Meadows |
|
33.1 |
21.4 |
34.2 |
22.2 |
35.2 |
23.2 |
39.2 |
24.4 |
|
Stevens Pass |
|
28.2 |
19.3 |
29.2 |
20.5 |
32.0 |
22.4 |
38.5 |
26.7 |
|
Bridger Bowl |
|
27.2 |
12.5 |
27.9 |
13.6 |
29.9 |
14.5 |
35.2 |
19.2 |
|
Jackson Hole |
|
18.1 |
9.7 |
17.2 |
8.7 |
19.0 |
10.6 |
23.2 |
13.8 |
|
Snowbird |
|
29.4 |
14.4 |
30.2 |
14.1 |
33.8 |
15.2 |
38.0 |
19.8 |
|
Aspen |
|
26.0 |
10.3 |
25.5 |
8.9 |
27.6 |
10.5 |
31.4 |
14.5 |
|
Vail |
|
22.5 |
7.0 |
21.3 |
5.9 |
23.8 |
7.8 |
28.4 |
12.0 |
|
Taos |
|
24.3 |
10.7 |
24.3 |
9.5 |
27.4 |
12.1 |
32.2 |
14.8 |
|
Mt. Washington |
|
17.1 |
1.1 |
13.4 |
-3.4 |
13.7 |
-3.7 |
19.6 |
4.9 |
Originally I determined for the same Westwide sample areas how many of those months had 15-20 percent water (heavy, wet snow) and over 20 percent water (a strong indicator of rain). In 2013 I reviewed all water content info from the 1979-1995 Westwide areas with sufficient data. I have also included more extensive independent data from Gothic in Colorado and from Mammoth. The results are grouped among the 3 snowpack classifications defined by avalanche researchers.
| Continental | Total | Wet Snow | Months |
| Water Content | Water to | Months: | with Rain: |
| Total Snow | 15-20% Water | Over 20% Water | |
| A-Basin, CO | 7.4% | 0.0% | 0.0% |
| Berthoud Pass, CO | 7.2% | 0.0% | 0.0% |
| Breckenridge, CO | 7.6% | 0.0% | 0.0% |
| Copper Mt., CO | 6.7% | 0.0% | 0.0% |
| Vail, Co | 6.9% | 0.0% | 0.0% |
| Winter Park, Co | 7.0% | 0.0% | 0.0% |
| Aspen Mt., CO | 7.6% | 0.0% | 0.0% |
| Aspen Highlands, CO | 8.0% | 0.0% | 0.0% |
| Gothic, CO | 6.3% | 0.0% | 0.0% |
| Crested Butte, CO | 7.7% | 0.0% | 0.0% |
| Monarch, CO | 7.2% | 0.0% | 0.0% |
| Telluride, CO | 7.0% | 2.0% | 0.0% |
| Purgatory, CO | 7.4% | 0.0% | 0.0% |
| Taos, NM | 6.3% | 0.0% | 0.0% |
| Intermountain | Total | Wet Snow | Months |
| Water Content | Water to | Months: | with Rain: |
| Total Snow | 15-20% Water | Over 20% Water | |
| Bridger Bowl, MT | 8.0% | 0.0% | 0.0% |
| Jackson Hole, WY | 9.1% | 0.0% | 0.0% |
| Sun Valley, ID | 8.2% | 0.0% | 0.0% |
| Snowbird, UT | 8.5% | 3.1% | 0.0% |
| Solitude, UT | 8.6% | 0.0% | 0.0% |
| Wolf Creek, CO | 9.3% | 1.4% | 0.0% |
Most of the results in the above tables shouldn't surprise anybody.
Rain or snow over 15 percent water are basically nonexistent at any of the Rocky
Mountain sites. Nearly all the Colorado sites are all continental with water
content from 6-8% while the Rockies areas farther west are all intermountain
with water content from 8-9+%. The exception is Wolf Creek, which has a well
known microclimate funneling southern storm tracks, greatly boosting snowfall
and moderately increasing snow density into the intermountain bracket. The avalanche
research article above classified Wolf Creek as intermountain in 14 out of 17 seasons.
| Coastal | Total | SWE | Wet Snow | Months |
| Water Content | Water to | Melted | Months: | with Rain: |
| Total Snow | Snow | 15-20% Water | Over 20% Water | |
| Alyeska, AK | 9.8% | 9.1% | 5.3% | 7.4% |
| Stevens Pass, WA | 12.3% | 10.0% | 19.5% | 15.6% |
| Crystal 6,000, WA | 11.1% | 9.7% | 10.6% | 8.5% |
| Rainier Paradise, WA | 12.4% | 11.6% | 20.0% | 13.3% |
| Mt. Hood Meadows, OR | 15.6% | 11.1% | 14.5% | 34.5% |
| Alpine Meadows, CA | 13.1% | 11.9% | 14.4% | 13.3% |
| Squaw 6,200, CA | 15.4% | 10.9% | 13.0% | 26.1% |
| Mammoth, CA | 12.9% | 12.8% | 19.1% | 0.8% |
| Mt. Washington, NH | 17.6% | N/A | 37.5% | 35.0% |
For the coastal sites in the Westwide Network I have included an extra column showing
the water content of snow only. The difference between this and the first column
total water to total snow is an indication of how much winter precipitation is in the
form of rain. Most of these sites show significant winter rain. The one that does
not is Mammoth, which only recorded 14 winter days of rain from 1982-2014 due to
its measuring site being at 9,000 feet. Only over New Year's 1997 was there sustained
rain at Mammoth's 11,000 foot summit. Note that despite Mammoth's near immunity to
rain the density of its snow is very bit as high as other coastal sites in WA, OR and CA.
The avalanche research article classified Mammoth as coastal in 12 out of 18 seasons.
Alyeska's climate deviates from most coastal areas in a different way. The under 10%
density of its snow is more like the intermountain areas. However, rain incidence is
still significant at its very low altitude. The avalanche research article classified
Alyeska as coastal in 14 out of 19 seasons. I was disappointed that the Westwide data
sheets included snowfall but not water content for the "interior Northwest" areas of
Schwietzer, ID and Whitefish, MT. My guess is that these areas would average intermountain
snow density but still show some rain incidence, similar to Alyeska.
Mt. Washington, NH receives more rain than any
of the western sites despite much lower average temperatures.
The following table dramatically illustrates the incidence of rain between East and West. The Mt. Mansfield (Stowe, Vermont) figures are based upon daily records from 1982 to 2010 at 3,950 feet, near the top of the ski area. Southern California figures are based upon snow reports from 1978 to 2010 at an average elevation of 7,500 feet. In the East precipitation is as high in fall and spring as in the winter and is much more likely to be rain. In the West fall and spring are drier than winter but at most ski areas the precipitation will still be snow.--T.C.
|
Month (Stowe) |
Nov. |
Dec. |
Jan. |
Feb. |
Mar. |
Apr. |
Total |
|
Avg. Days Rain |
3.78 |
1.88 |
1.44 |
1.03 |
2.26 |
4.74 |
15.13 |
|
Avg. Rainfall |
2.32 |
1.26 |
0.89 |
0.50 |
1.04 |
2.02 |
8.03 |
|
|
|
|
|
|
|
|
|
|
Month (So. Cal) |
Nov. |
Dec. |
Jan. |
Feb. |
Mar. |
Apr. |
Total |
|
Avg. Days Rain |
0.35 |
0.89 |
1.14 |
0.97 |
0.35 |
0.08 |
3.78 |
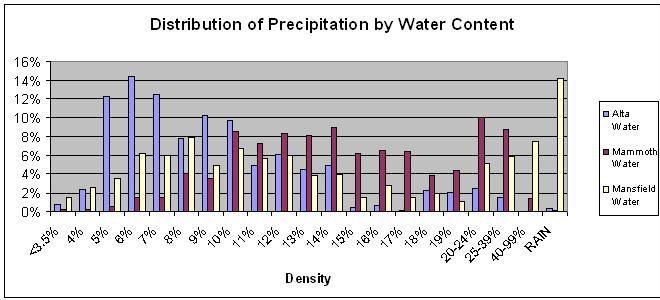
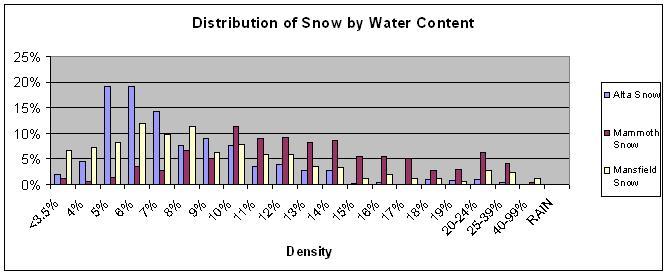
The tables above still do not shed light upon snow density in New England vs. western ski areas. To do this I have further analyzed daily snow records at Alta, Mammoth and the Mansfield stake. The graph below shows the distribution of snowfall only by water content of the snow.