Worst 7 Western
Ski Area Winters
The recent feature on OpenSnow https://opensnow.com/news/post/top-10-deepest-winters-in-the-west-since-1980 prompted me to review my data and refine the exercise (https://bestsnow.net/Best_Seasons.htm). Here is the sequel analyzing the worst western winters.
The priorities are similar but not exactly the same:
- Focus on the Western U.S. and Southern Canada – The only difference is that I included Alyeska among
the Pacific Northwest areas
- Focus on seasons with low snowfall (relative to
average) across large portions of the West – I defined this as seasons more than one standard
deviation below average.
- Focus on the worst starts to the season. -- I examined
November/December snowfall as a percent of average. For rating worst
ski seasons the first part of the season is critically important. It determines when lifts and terrain can
open and economically it determines whether the Christmas holiday season
is a success or a bust. For extra
insight I looked at November – January as well to highlight seasons with
extended time of limited operation.
- Focus on seasons with ski resorts that experienced
record dry winters. - I gave extra credit for record low
seasons. Record lows can have
recency bias as it’s easier to have a record low in 10 years of data than
in 40 years.
- In addition to low snowfall, were seasons impacted by
excessive rain or heat?
- In the West only the worst of
years does snowpack melt out enough mid-season to close terrain. Usually the existing snowpack was
already subpar.
- Did many areas escape the snowfall drought? -- I examined
areas that were above average with extra credit if they were more than one
standard deviation above average.
This was a secondary tiebreaker.
Snowfall and Snowpack Data
The devil is in the details here, and I worked diligently to avoid recency bias. That can happen easily when there is more data for recent seasons than for those longer ago. I combat that problem in two key ways.
1) I count areas with low, record low, above average and high snowfall not as absolute numbers but as a percentage of total areas reporting data.
2) Since volume of data varies by region I calculate percents of average snowfall within 7 major western ski regions, then average those 7 numbers. Some regions have more areas reporting than others, and the data disparity among regions might be quite different in 1985 than in 2025.
I do not like to use SNOTEL snowpack data as a surrogate for snowfall. It works OK in places like Colorado where it never rains in the winter, but in places that get rain and highly variable water content snow it’s not very accurate.
From
OpenSnow:
In particular, past-season snowfall data is lacking across
the Southwest, and to a lesser extent, the Northern Rockies and the Interior of
Canada.
Full
season data does not go back as far, but December-March data does for many
locations. Accordingly I use December-March for the Southwest before 1995 and
for the US Northern Rockies before 1989.
In Canada Sunshine, Lake Louise and Mt. Fidelity near Rogers Pass have
complete data to the early 1970’s.
From
OpenSnow:
The availability of snowfall and snowpack data at or near
ski resorts is extremely limited prior to 1980. While there were certainly some
amazing winters back in the day, it was too difficult to compare pre-1980
winters to post-1980 winters due to the lack of data.
When
I started collecting data in 1992 from the Westwide Network, their history
generally started with the 1978-79 season so I consider data very adequate
since then. Data declines gradually
going back from there but there is at least something representative with full
season data in each of the 7 regions starting with 1973.
In
the table below I list the number of areas reporting for each candidate season.
|
Areas Reporting |
Season Percent Normal |
California |
Pacific Northwest |
Interior Canada |
U.S. Northern Rockies |
Utah |
Northern & Central Colorado |
Southern & Western Colorado |
Combined 7 Western Regions |
|
30 |
76-77 |
46% |
48% |
73% |
66% |
56% |
70% |
52% |
59% |
|
65 |
25-26 |
71% |
61% |
101% |
67% |
52% |
54% |
55% |
66% |
|
71 |
14-15 |
39% |
49% |
84% |
67% |
59% |
91% |
80% |
67% |
|
45 |
80-81 |
68% |
67% |
94% |
70% |
69% |
60% |
54% |
69% |
|
75 |
86-87 |
66% |
83% |
87% |
66% |
68% |
70% |
88% |
75% |
|
79 |
91-92 |
88% |
69% |
74% |
73% |
73% |
86% |
71% |
76% |
|
79 |
11-12 |
73% |
123% |
123% |
97% |
69% |
60% |
75% |
89% |
Overall percent of season snowfall should be the first
criterion in evaluating the western ski seasons. Despite limited data 1976-77 stands out. It’s the only year with all western regions
under 80% (red) along with a comfortable lead over other seasons at 59% of
normal in aggregate
The
next group of three seasons from 66-69% should be considered essentially the
same with other criteria to be considered in separating them. The same is true
for the two seasons from 75-76%. Far
behind are five seasons which averaged 86-89% in aggregate. Why did I single our 2011-12 among
those? It’s the only one with four
regions under 80% and it started out as bad as some of the top six. 2011-12 had much national notoriety at the
time because the Northeast was also bad and the poor western regions are the
ones with the most skier visits.
Here are the worst November/Decembers.
|
Nov.-Dec. Percent Normal |
California |
Pacific Northwest |
Interior Canada |
U.S. Northern Rockies |
Utah |
Northern & Central Colorado |
Southern & Western Colorado |
Combined 7 Western Regions |
|
76-77 |
29% |
13% |
88% |
39% |
15% |
46% |
38% |
38% |
|
23-24 |
28% |
63% |
71% |
51% |
67% |
71% |
67% |
60% |
|
80-81 |
31% |
68% |
140% |
71% |
44% |
44% |
48% |
64% |
|
25-26 |
72% |
52% |
116% |
75% |
36% |
51% |
50% |
65% |
|
86-87 |
32% |
80% |
84% |
69% |
43% |
66% |
94% |
67% |
|
17-18 |
26% |
93% |
106% |
109% |
43% |
64% |
33% |
68% |
|
11-12 |
34% |
87% |
102% |
73% |
54% |
45% |
79% |
68% |
|
91-92 |
81% |
76% |
81% |
94% |
109% |
96% |
96% |
91% |
|
14-15 |
61% |
66% |
93% |
100% |
86% |
129% |
111% |
92% |
This is the category where 1976-77 is in a class by itself at 38%. Most of us have unpleasant memories of at least a few of that next group of slow starting seasons, but 1976-77 was on another level, especially with very little snowmaking back then. 2017-18 and 2023-24 improved sharply after New Year’s in most regions, finishing at 91% and 95% and thus are not on the overall list. The 1991-92 and 2014-15 seasons did not start out bad aside from 2014-15 on the West Coast but were much drier midwinter. Aside from 2011-12, the other seasons that ended up at 86-89% most were 81% for November-December.
Adding in January:
|
Nov.-Jan. Percent Normal |
California |
Pacific Northwest |
Interior Canada |
U.S. Northern Rockies |
Utah |
Northern & Central Colorado |
Southern & Western Colorado |
Combined 7 Western Regions |
|
76-77 |
38% |
19% |
72% |
61% |
28% |
52% |
55% |
47% |
|
25-26 |
64% |
54% |
101% |
63% |
47% |
54% |
53% |
62% |
|
80-81 |
71% |
58% |
101% |
69% |
59% |
45% |
42% |
64% |
|
14-15 |
39% |
52% |
84% |
84% |
68% |
99% |
84% |
73% |
|
11-12 |
42% |
104% |
107% |
81% |
61% |
59% |
81% |
76% |
|
86-87 |
56% |
91% |
87% |
76% |
63% |
76% |
100% |
78% |
|
91-92 |
69% |
86% |
94% |
78% |
83% |
86% |
80% |
82% |
1976-77 is still worst, but of the other seasons only 1980-81 and 2025-26 remain under 70% of normal at the end of January. 2014-15 is now in 4th place after a very dry January.
So
now let’s look at the proportion of areas with bad years.
|
Season |
Percent Record Low |
Season |
%>1 SD Below Average |
|
|
1976-77 |
30% |
83% |
1976-77 |
53% |
|
2025-26 |
23% |
71% |
2025-26 |
48% |
|
2014-15 |
21% |
63% |
2014-15 |
42% |
|
1991-92 |
6% |
56% |
1991-92 |
49% |
|
1980-81 |
4% |
51% |
1980-81 |
47% |
|
1986-87 |
3% |
47% |
1986-87 |
44% |
|
2011-12 |
6% |
30% |
2011-12 |
24% |
Several seasons have around half of reporting areas more than one standard deviation below average but 1976-77, 2014-15 and 2025-26 stand out in terms of most record lows. The 2014-15 records were in the Pacific states while most of the 2025-26 records were in the Rockies. The middle column adds those two stats together for an overall “bad season” rating.
Here are the results for the fewest areas which had above average and good seasons.
|
Season |
Fewest% > 1SD
Abv Avg |
Season |
Percent Above Average |
|
|
1980-81 |
0% |
2% |
1980-81 |
2% |
|
2014-15 |
0% |
4% |
2014-15 |
4% |
|
1976-77 |
0% |
7% |
1976-77 |
7% |
|
2025-26 |
5% |
8% |
2025-26 |
3% |
|
1991-92 |
6% |
11% |
1991-92 |
5% |
|
1986-87 |
3% |
13% |
1986-87 |
11% |
|
2011-12 |
15% |
30% |
2011-12 |
15% |
The four overall worst snowfall seasons lead these categories. The middle column adds the two stats together. 2011-12 is an outlier because the season was excellent in the Northwest and western Canada.
What seasons were impacted by extreme rain or heat?
These issues are hard to quantify and can be subject to recency bias. Fortunately these impacts are infrequent in the West overall for a few reasons:
1) Rain is generally confined to the Pacific States and parts of British Columbia, and even within those regions it’s rare in some key places like Mammoth and the Whistler alpine.
2) Early season warm weather that delays snowmaking goes hand in hand with drought in the West, so the Nov/Dec/Jan snowfall data picks that up and identifies the worst starts without the need for temperature data.
3) Spring snowpack at most destination resorts peaks in late March on average so most areas close due to lack of interest before much terrain loses snow cover.
4) Therefore, for either rain or heat to restrict open terrain, the snowpack needs to be abnormally low. From the snowfall info we have, we know which seasons to investigate. Two deserve special scrutiny.
2014-15 is the lowest snowfall season in California and tied for lowest in the Pacific Northwest. This season was plagued by repeated rain events which degraded the thin snowpack and prevented full operation of numerous ski areas. There were some premature closures in mid-March, notably Mt. Baker, the highest snowfall ski area in the world.
2025-26 also saw a lot of rain. The Pacific States had considerably more snow than in 2014-15, so reductions in open terrain were not as severe. However the warm storms in 2025-26 extended into the Intermountain region, with rain degrading base areas in location like Snowbasin, Park City and Jackson Hole.
Finally, the March 2026 heat wave was unprecedented in terms of both severity and that it covered nearly the entire western U.S.
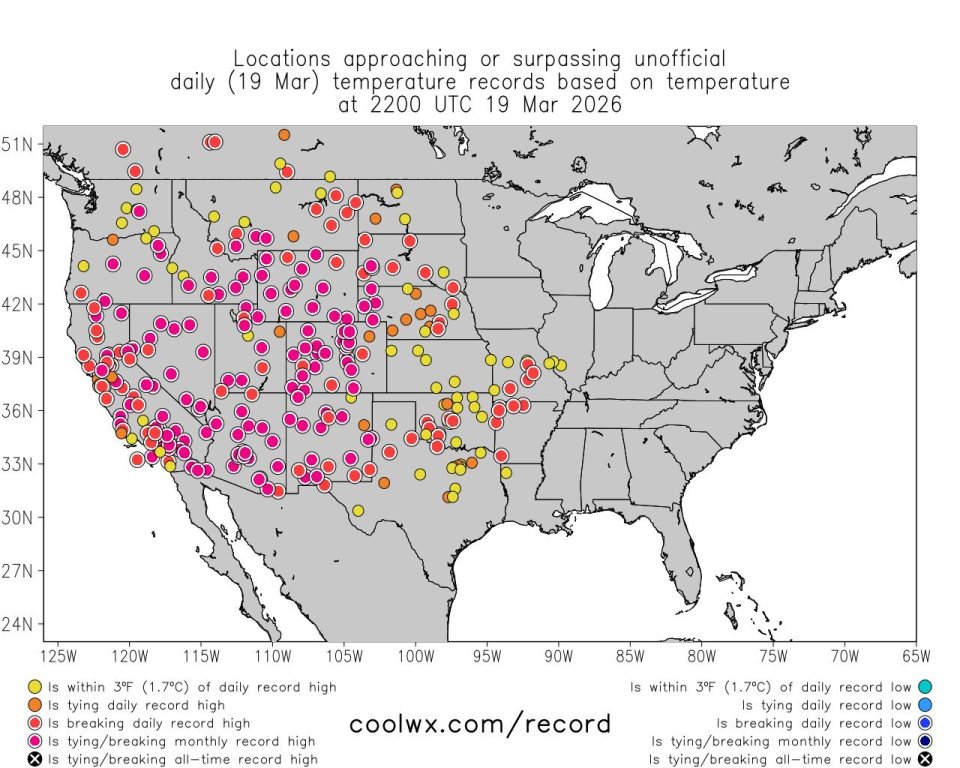
This is not recency bias. Note the pink locations are record highs not just for the date but for the entire month of March. Normal March 1 snowpacks would survive an event like this, but with the thin snowpacks nearly all western U.S. areas had to close some terrain and lower/less favorably exposed ski areas closed completely before the end of March.
Overall Rankings:
|
Season Percent Normal |
Combined 7 Western Regions |
Nov-Dec |
Nov-Jan |
Bad Years |
Bad Years - Above Avg Yrs |
Rain and/or Heat |
Rank |
El Nino/ La Nina |
|
76-77 |
59% |
38% |
47% |
83% |
77% |
|
1 |
EN |
|
25-26 |
66% |
65% |
62% |
71% |
63% |
Both |
2 |
|
|
14-15 |
67% |
92% |
73% |
63% |
59% |
Rain |
3 |
EN |
|
80-81 |
69% |
64% |
64% |
51% |
49% |
|
4 |
|
|
86-87 |
75% |
67% |
78% |
47% |
33% |
|
5 |
EN++ |
|
91-92 |
76% |
91% |
82% |
56% |
45% |
|
6 |
EN++ |
|
11-12 |
89% |
68% |
76% |
30% |
0% |
|
7 |
LN |
1976-77 is #1 across the board in the data categories and by a huge margin for driest early season. Among the next 3 seasons with similar total snowfall 2025-26 has the edge for #2 due to a bad early season combined with the March meltdown limiting the late season.
The closest call is between 2014-15 #3 and 1980-81 #4. The case for 1980-81 is the bad early season similar to 2025-26. But 2014-15 had many more record lows and the excessive rain in the coastal regions made the season worse than the snowfall numbers and incidence imply. These two seasons are close enough that if considering North America overall 1980-81 would be worse because it was bad in the East as well as in the West.
For the next two years 1986-87 #5 is clearly worse than 1991-92 #6 due to a much slower starting early season.
As noted before, there’s a large gap in overall snowfall from the 6 worst seasons to the next 5 between 86-89%. That is also reflected in fewer areas with bad seasons in 2011-12 and more areas with good ones. Only in the early season stats is 2011-12 #7 comparable to the other 6 seasons. At the time, note that it had been 20 years since a truly bad overall season. The bad memory of 2011-12 is primarily due to its being the third worst season in the Northeast and tied for second worst in I-70 Colorado, the two regions in North America with the most skier visits.
Appendix: 2025-26 Open Terrain vs. Prior Dry Seasons
Since 2004 I have tracked percents of terrain open at major ski areas in North America. In normal seasons western destination resorts usually progress toward majority operation by Christmas and nearly full operation by mid-January. Once terrain opens, it’s rare for it to be closed before April, especially in the higher resorts where rain is rare. The worst seasons are the exception, and accordingly I’ve rounded up data for selected resorts during their worst seasons. The caveat is that of the overall worst seasons I only have the two most recent 2014-15 and 2025-26. I include some other recent seasons that were bad In a few regions even though they were better in others. I also include month by month snowfalls so snowfall incidence in older lean seasons like 1976-77 and 1980-81 can be compared to the recent seasons with open terrain stats.
California
Mammoth lean seasons:
|
snow |
Nov. |
Dec. |
Jan. |
Feb. |
Mar. |
Apr. |
May |
max
base |
|
|
75-76 |
27.00 |
14.50 |
13.50 |
54.00 |
50.00 |
38.50 |
6.00 |
203.50 |
65.00 |
|
76-77 |
0.00 |
0.00 |
26.00 |
27.00 |
37.00 |
0.00 |
40.00 |
130.00 |
36.00 |
|
86-87 |
0.00 |
0.00 |
54.70 |
69.85 |
58.00 |
8.20 |
2.00 |
192.75 |
69.00 |
|
90-91 |
6.75 |
27.80 |
11.40 |
6.30 |
175.95 |
5.90 |
13.00 |
247.10 |
112.00 |
|
06-07 |
5.00 |
54.50 |
12.50 |
96.00 |
13.00 |
26.50 |
5.00 |
212.50 |
96.00 |
|
11-12 |
30.00 |
2.00 |
55.00 |
28.00 |
73.50 |
36.00 |
0.00 |
224.50 |
84.00 |
|
13-14 |
12.50 |
18.00 |
13.50 |
50.50 |
45.00 |
43.00 |
6.50 |
189.00 |
65.00 |
|
14-15 |
13.50 |
48.00 |
2.50 |
25.00 |
7.00 |
29.50 |
24.50 |
150.00 |
45.00 |
|
17-18 |
35.50 |
4.00 |
33.50 |
23.00 |
142.00 |
7.00 |
4.50 |
249.50 |
138.00 |
|
25-26 |
24.00 |
67.00 |
45.50 |
88.00 |
1.00 |
50.00 |
2.00 |
277.50 |
99.00 |
|
pct open |
15-Dec |
31-Dec |
15-Jan |
31-Jan |
14-Feb |
28-Feb |
15-Mar |
31-Mar |
|
|
06-07 |
13% |
60% |
70% |
50% |
80% |
100% |
100% |
95% |
|
|
11-12 |
13% |
14% |
14% |
80% |
85% |
80% |
85% |
100% |
|
|
13-14 |
10% |
25% |
17% |
17% |
75% |
85% |
95% |
95% |
|
|
14-15 |
35% |
60% |
60% |
60% |
70% |
70% |
71% |
43% |
|
|
17-18 |
71% |
71% |
80% |
91% |
85% |
84% |
100% |
100% |
|
|
25-26 |
38% |
67% |
98% |
98% |
95% |
94% |
97% |
75% |
The 3 most
recent seasons benefited from some early warm storms that were heavy snow on
the upper half of Mammoth, mixed precipitation at the Main Lodge snow plot and
mostly rain at Tahoe. 2013-14 is the most recent season where severe drought
extended deep into the season. 1975-76 and 1986-87 look comparable and 1976-77
and 1990-91 were worse. Once terrain opens preservation usually withstands dry
spells and keeps it open. There was a modest decline in the March 2026 heat
wave and a more significant one in 2015 when the base was much lower and it was
the only other season besides 1976-77 when Mammoth never reached full
operation.
Palisades
Tahoe
|
Alpine snow |
Nov. |
Dec. |
Jan. |
Feb. |
Mar. |
Apr. |
||
|
75-76 |
14.00 |
23.00 |
15.00 |
73.00 |
43.00 |
17.00 |
185.00 |
|
|
76-77 |
10.00 |
12.00 |
35.00 |
58.00 |
49.00 |
6.00 |
170.00 |
|
|
86-87 |
6.00 |
22.50 |
70.50 |
56.50 |
50.50 |
6.00 |
212.00 |
|
|
90-91 |
16.50 |
42.00 |
8.00 |
15.50 |
188.00 |
19.00 |
289.00 |
|
|
06-07 |
25.00 |
48.00 |
11.50 |
112.50 |
25.00 |
50.00 |
272.00 |
|
|
11-12 |
20.50 |
1.50 |
40.00 |
43.50 |
136.00 |
44.00 |
285.50 |
|
|
13-14 |
4.00 |
28.00 |
12.50 |
50.50 |
51.50 |
46.00 |
192.50 |
|
|
14-15 |
17.00 |
37.00 |
1.00 |
25.50 |
16.50 |
34.50 |
131.50 |
|
|
17-18 |
21.50 |
9.00 |
33.50 |
39.50 |
192.00 |
17.00 |
312.50 |
|
|
25-26 |
10.00 |
42.00 |
37.50 |
97.50 |
0.00 |
60.00 |
247.00 |
|
|
Palisades pct open |
15-Dec |
31-Dec |
15-Jan |
31-Jan |
14-Feb |
28-Feb |
15-Mar |
31-Mar |
|
06-07 |
2% |
65% |
70% |
60% |
70% |
100% |
100% |
85% |
|
11-12 |
5% |
5% |
2% |
30% |
55% |
70% |
69% |
76% |
|
13-14 |
6% |
17% |
18% |
9% |
30% |
30% |
45% |
41% |
|
14-15 |
18% |
59% |
32% |
25% |
31% |
21% |
32% |
24% |
|
17-18 |
24% |
23% |
22% |
37% |
37% |
40% |
85% |
85% |
|
25-26 |
1% |
71% |
83% |
89% |
76% |
42% |
48% |
21% |
Snowfall is
from the comprehensive Alpine Meadows patrol site. Palisades’ open terrain
pattern was similar to Mammoth's in 2006-07 but much worse in all of the other
recent lean seasons. The last 3 of these had early storms that were mostly rain
at Palisades and mostly snow at Mammoth. With much lower altitude, Palisades
does not hold up as well during mid-season droughts. And its topography
requires more coverage to open terrain vs. Mammoth.
Summary:
2025-26 snowfall ranged from less than 60% at low elevation to about 80% at
high elevation due storms with high rain/snow lines, with some of these storms
being in November/December. Mammoth was only slightly below average in open
terrain for the season overall. Palisades' open terrain contracted after rain
events, but overall Sierra terrain is most restricted in seasons with severe
early season droughts, of which there have been many. Nov.-Jan. snowfall at
Alpine Meadows was 44 inches in 2013-14, 52 in 1975-76, 55 in 2014-15, 57 in
1976-77, 62 in 2011-12 and 66 in 1990-91. How would I rank these Tahoe seasons?
1) 2014-15 had the lowest total season snowfall and considerable low elevation
rain as well.
2) 2013-14 actually had less open terrain at Palisades than 2014-15, because
the upper half of Palisades had 83 inches in Dec. 2014. But lower Tahoe areas
had to be worse in 2014-15.
3) 1976-77
4) 1975-76, slightly more Feb. and later snow than 1976-77
5) 1990-91, very dry through Feb. though March was huge.
6) 2011-12, Feb. much better than 1990-91, a big March not as much as 1990-91.
Mammoth has some differences, a much drier 1976-77 (moving that season to #1)
and a 1986-87 similar to 1975-76. 2013-14 is #2 due to incidence of dry months
vs. 2014-15 and rain being less of a factor than at Tahoe. Other seasons are in same order as Tahoe.
Pacific
Northwest
The Pacific
Northwest was not immune to the still worst ever early season drought of
1976-77.
|
76-77 |
Nov. |
Dec. |
Jan. |
Feb. |
Mar. |
Apr. |
max base |
||
|
Whistler |
15.35 |
64.57 |
94.09 |
29.13 |
|||||
|
Snoqualmie |
2.00 |
19.00 |
23.00 |
35.00 |
112.00 |
0.00 |
191.00 |
||
|
Paradise |
7.00 |
34.20 |
25.50 |
11.00 |
180.50 |
36.00 |
294.20 |
122.00 |
|
|
Bachelor |
5.00 |
5.00 |
32.00 |
11.00 |
88.00 |
5.00 |
0.00 |
146.00 |
81.00 |
|
Crater
Lake |
5.50 |
11.30 |
30.00 |
52.50 |
83.50 |
8.50 |
191.30 |
64.00 |
There is no
reason to believe the missing Nov/Dec 1976 at Whistler had much snow. Whistler
finally got going in February and the whole region had a good late season.
2004-05
snowfall numbers are not as low as 1976-77, but the open terrain tells the big
story of the season, the late January Tropical Punch 4 days of torrential rain.
|
04-05 |
Nov. |
Dec. |
Jan. |
Feb. |
Mar. |
Apr. |
max base |
||
|
Whistler |
31.00 |
51.00 |
16.00 |
18.00 |
56.00 |
78.00 |
18.00 |
268.00 |
86.00 |
|
Stevens
Pass |
20.00 |
45.00 |
33.00 |
28.00 |
51.00 |
27.00 |
204.00 |
||
|
Snoqualmie |
19.00 |
57.00 |
35.00 |
23.00 |
65.00 |
15.00 |
214.00 |
||
|
Paradise |
44.00 |
77.00 |
45.00 |
38.50 |
96.25 |
62.25 |
363.00 |
95.00 |
|
|
Hood
Mdws |
13.00 |
38.00 |
39.00 |
28.00 |
42.00 |
30.00 |
190.00 |
61.00 |
|
|
Bachelor |
10.00 |
54.00 |
32.00 |
20.00 |
54.00 |
24.00 |
194.00 |
83.00 |
|
|
Crater
Lake |
17.10 |
74.00 |
68.20 |
19.30 |
76.00 |
41.80 |
296.40 |
91.00 |
|
|
04-05 |
15-Dec |
31-Dec |
15-Jan |
31-Jan |
14-Feb |
28-Feb |
15-Mar |
31-Mar |
|
|
Whistler |
60% |
72% |
78% |
55% |
85% |
85% |
60% |
85% |
|
|
Stevens
Pass |
open |
open |
0% |
0% |
0% |
0% |
0% |
reopen |
|
|
Crystal
Mt. |
45% |
43% |
41% |
0% |
0% |
0% |
0% |
0% |
90% |
|
Hood
Mdws |
30% |
65% |
100% |
0% |
80% |
80% |
50% |
78% |
|
|
Bachelor |
70% |
100% |
100% |
100% |
100% |
100% |
100% |
100% |
This was at
least as severe as what happened in the Sierra late February 2026. At lower
elevations it wiped out the snowpack and shut down skiing, with not much
revival due to a dry February and first half of March. Only in late March and
April was there enough new snow to rebuild the base. The Tropical Punch did not
reach as far south as Mt. Bachelor, so it had a decent season despite low
snowfall.
Many of the
2014-15 total snowfall numbers are comparable to 1976-77.
|
14-15 |
Nov. |
Dec. |
Jan. |
Feb. |
Mar. |
Apr. |
max base |
||
|
Whistler |
52.00 |
63.00 |
39.00 |
31.00 |
48.00 |
27.00 |
4.00 |
264.00 |
77.00 |
|
Stevens
Pass |
44.00 |
40.00 |
43.00 |
13.00 |
16.00 |
28.00 |
184.00 |
39.00 |
|
|
Snoqualmie |
24.00 |
34.00 |
16.00 |
6.00 |
4.00 |
20.00 |
104.00 |
||
|
Paradise |
28.00 |
78.00 |
35.20 |
39.30 |
24.80 |
41.60 |
246.90 |
85.00 |
|
|
Hood
Mdws |
38.00 |
76.00 |
16.50 |
17.00 |
23.00 |
24.00 |
194.50 |
55.00 |
|
|
Bachelor |
54.00 |
69.00 |
11.00 |
29.00 |
17.00 |
20.00 |
1.00 |
201.00 |
53.00 |
|
Crater
Lake |
59.40 |
33.10 |
7.10 |
30.90 |
22.90 |
38.00 |
191.40 |
42.00 |
|
|
14-15 |
15-Dec |
31-Dec |
15-Jan |
31-Jan |
14-Feb |
28-Feb |
15-Mar |
31-Mar |
10-Apr |
|
Whistler |
40% |
80% |
81% |
81% |
76% |
79% |
79% |
75% |
75% |
|
Stevens
Pass |
0% |
45% |
41% |
69% |
73% |
69% |
0% |
0% |
0% |
|
Crystal
Mt. |
0% |
100% |
100% |
54% |
21% |
40% |
20% |
20% |
20% |
|
Hood
Mdws |
0% |
69% |
57% |
57% |
69% |
64% |
47% |
38% |
38% |
|
Bachelor |
43% |
40% |
40% |
68% |
65% |
54% |
54% |
54% |
54% |
While it
didn't have the extreme early drought, it had repeated rain episodes, so often
that rarely were any of these areas in full operation. As a result the low
elevations melted out in March. Mt. Baker closed the same time Stevens Pass
did. Overall this is a strong candidate for the worst Pacific Northwest season.
2025-26 was
probably as rainy as 2014-15, but there was much more snow from Mt. Hood north.
|
25-26 |
Nov. |
Dec. |
Jan. |
Feb. |
Mar. |
Apr. |
max base |
||
|
Whistler |
35.43 |
98.03 |
57.09 |
58.27 |
38.98 |
13.78 |
0.79 |
302.37 |
93.00 |
|
Stevens
Pass |
14.00 |
51.00 |
47.50 |
36.00 |
112.10 |
17.00 |
277.60 |
109.00 |
|
|
Snoqualmie |
10.00 |
56.00 |
38.00 |
20.00 |
74.00 |
16.00 |
214.00 |
||
|
Rainier |
35.70 |
80.70 |
68.40 |
60.90 |
114.00 |
49.00 |
408.70 |
144.00 |
|
|
Hood
Mdws |
0.00 |
21.50 |
46.50 |
62.00 |
52.50 |
12.00 |
194.50 |
89.00 |
|
|
Bachelor |
4.00 |
37.00 |
37.00 |
50.00 |
18.00 |
39.00 |
185.00 |
54.00 |
|
|
Crater
Lake |
9.60 |
53.60 |
44.70 |
52.80 |
9.00 |
46.90 |
216.60 |
51.00 |
|
|
25-26 |
15-Dec |
31-Dec |
15-Jan |
31-Jan |
14-Feb |
28-Feb |
15-Mar |
31-Mar |
10-Apr |
|
Whistler |
35% |
88% |
79% |
83% |
87% |
90% |
91% |
92% |
88% |
|
Stevens
Pass |
0% |
94% |
74% |
67% |
62% |
62% |
86% |
84% |
75% |
|
Crystal
Mt. |
0% |
66% |
35% |
26% |
47% |
56% |
50% |
47% |
42% |
|
Hood
Mdws |
0% |
48% |
70% |
57% |
70% |
69% |
100% |
46% |
50% |
|
Bachelor |
0% |
56% |
60% |
62% |
70% |
70% |
71% |
56% |
40% |
The rain and
ensuing bad surfaces made full operation rare, but the low elevation snowpacks
did not get wiped out as early as in 2005 and 2015. Mt. Bachelor was as bad as
in 2015. The Whistler alpine is clearly the most resilient part of the region
during these warm seasons. I had excellent Whistler trips myself in late
March/early April of both 2005 and 2015. But I also had an ill-timed Canada trip right after the 2005 Tropical Punch.
Summary
This region
is highly drought resistant. 1976-77 is the only year with an early season
drought on the level of what other regions get more often. The worst years are
the ones with too much rain vs. snow. Even in those rainy years the Whistler
alpine builds a snow base, often starting before snow is measured at its snow
plot lower down.
So for Whistler:
1) 1976-77 is worst
2) 2004-05, where the Tropical Punch rain set Whistler back to 55% for a few
weeks.
3) 2014-15, lowest snowfall of past 46 years, 264 vs. 268 in 2004-05.
4) 2025-26, another rainy year but just over 300 inches.
5) 2013-14, second lowest Nov/Dec at 73 inches, 60% open at New Year's is
lowest in my 20 years of records.
Washington State, Northern Idaho:
1) 2004-05, The Tropical Punch and an ensuing dry spell closed ski areas from
late January through late March.
2) 2014-15, Some record low snowfalls and lots of rain. Reduced terrain in
February and some areas closed early March.
3) 1976-77, Mt. Rainier Paradise, which averages nearly 50% more snow than the
ski areas, had 78 inches through February. March was very snowy for a solid
late season though.
4) 2025-26, much more snow ~300 inches than #1&2 above, but so much rain
that rarely were areas in full operation.
Oregon:
1) 2025-26 was just as rainy as the areas to the north but with much less snow.
2) 2014-15, similar to 2025-26 at Mt. Hood, not quite as bad at Bachelor
3) 1976-77, very dry through February but a snowy March
4) 2004-05, The Tropical Punch was less severe at Mt. Hood and did not get as
far south as Bachelor.
Interior
Western Canada
This region
does not figure much in overall worst western seasons because its weather is
more independent and even slightly negatively correlated to California and the
Southwest. There’s one drought year,
66% in 2000-01 and of the 7 seasons between 71% and 77%, only two of them,
1976-77 and 1991-92, correspond to the low snow years in the U.S. West. Two others, 1982-83 and 1992-93, are among
the best snow years in the U.S. West.
U.S.
Northern Rockies
This is a
difficult region to generalize because:
1) Only Jackson and Targhee have season 1976-77 data. For many places,
extensive data exists only Dec.-Mar.
2) This is a region where more areas have independent weather patterns.
2025-26 snowfalls by area:
Whitefish: 64% of normal Dec.-Mar., 5th lowest season out of 36
Bridger Bowl: 59% Dec.-Mar, tied for 1st lowest season out of 53. FYI Bridger
snowfall was above average Jan.-Mar. 1977
Sun Valley: 68%, Dec.-Mar., 9th lowest season out of 47
Areas with Nov.-Apr. data:
Brundage: 58%, the lowest season out of 38
Big Sky: 77%, 4th lowest season out of 40
Jackson: 69%, 4th lowest season out of 59, but in reality 2nd worst to 1976-77
due to the low elevation rain.
Targhee: 68%. 4th lowest season out of 50
If you aggregate the areas, the region as a whole comes out to 67%, which is
tied with 1976-77 and 2014-15 as the worst overall season for the region.
1991-92 was the worst season Dec.-Mar. at 53%, but overall it was 72% due to a
snowy November.
Jackson detail:
|
Nov. |
Dec. |
Jan. |
Feb. |
Mar. |
Apr. |
at
mid |
at
base |
||
|
76-77 |
8.00 |
28.50 |
60.00 |
29.00 |
42.50 |
22.00 |
190.00 |
83.00 |
|
|
80-81 |
38.00 |
67.00 |
61.00 |
44.00 |
23.00 |
2.00 |
235.00 |
||
|
86-87 |
57.00 |
16.50 |
65.00 |
50.60 |
33.70 |
9.20 |
232.00 |
97.10 |
|
|
06-07 |
44.00 |
57.00 |
26.00 |
64.00 |
11.00 |
35.00 |
237.00 |
83.00 |
|
|
14-15 |
79.00 |
73.00 |
56.00 |
43.00 |
15.00 |
21.00 |
287.00 |
107.20 |
|
|
23-24 |
14.20 |
38.40 |
66.30 |
89.70 |
75.10 |
20.30 |
304.00 |
154.00 |
|
|
25-26 |
17.80 |
76.00 |
39.30 |
48.20 |
23.50 |
48.30 |
253.10 |
84.30 |
|
|
15-Dec |
31-Dec |
15-Jan |
31-Jan |
14-Feb |
28-Feb |
15-Mar |
31-Mar |
Max
Base |
|
|
06-07 |
32% |
91% |
100% |
98% |
100% |
100% |
100% |
68% |
78.00 |
|
14-15 |
48% |
97% |
100% |
100% |
100% |
100% |
92% |
70% |
83.50 |
|
23-24 |
32% |
47% |
85% |
84% |
93% |
98% |
95% |
94% |
92.00 |
|
25-26 |
23% |
60% |
88% |
89% |
85% |
88% |
76% |
57% |
85.00 |
There is no
question that 1976-77 is worst for both total snow and early season coverage.
Note that in the abnormally warm 2025-26 season snowfall at Jackson's base was
nearly as low as in 1976-77, and the reality was probably worse due to a few
uncharacteristic rain episodes.
Targhee detail:
|
Nov. |
Dec. |
Jan. |
Feb. |
Mar. |
Apr. |
|||
|
76-77 |
15.00 |
64.00 |
120.00 |
80.00 |
68.00 |
25.00 |
372.00 |
|
|
86-87 |
48.00 |
28.00 |
85.00 |
55.00 |
30.00 |
6.00 |
252.00 |
|
|
91-92 |
52.00 |
59.00 |
76.00 |
48.00 |
11.00 |
12.00 |
258.00 |
|
|
14-15 |
94.00 |
65.00 |
56.00 |
35.00 |
19.00 |
32.00 |
301.00 |
|
|
25-26 |
21.00 |
76.00 |
53.00 |
62.00 |
26.00 |
79.00 |
317.00 |
|
|
15-Dec |
31-Dec |
15-Jan |
31-Jan |
14-Feb |
28-Feb |
15-Mar |
31-Mar |
|
|
14-15 |
100% |
100% |
100% |
100% |
100% |
100% |
100% |
100% |
|
25-26 |
63% |
92% |
94% |
95% |
93% |
93% |
93% |
91% |
Not much to
see here. Shown above are Targhee's only seasons under 300 inches. Was Targhee
90+% open Dec. 31 in 1976 and 1986? We don't know for sure but probably at
least 75% and close to 100% by mid-January. Targhee had 63 inches snowfall as
of Dec. 15, 2025 and was 63% open. Any other ski area would love to have those
1986-87 numbers be its worst season.
Interior
Northwest data is
minimal in the farther back years. But the main story in 2025-26 was too much
rain. Whitefish's location farther inland and a bit higher than other areas
made a big difference.
|
2025-26 |
15-Dec |
24-Dec |
31-Dec |
15-Jan |
31-Jan |
14-Feb |
28-Feb |
15-Mar |
31-Mar |
max base |
|
Schweitzer |
1% |
3% |
41% |
47% |
55% |
55% |
99% |
99% |
50% |
33.00 |
|
Whitefish |
55% |
92% |
92% |
95% |
95% |
90% |
93% |
97% |
81% |
58.00 |
Schweitzer
reported a 20 inch base on Feb. 14. Surely Whitefish got an attendance bump
from skiers fleeing its marginal competition. Most of the interior NW was bad.
Mt. Spokane barely opened. The highest snowfall area, Lookout Pass, got over
300 inches of snow but its base never exceeded 43 inches due to so much rain.
Utah
Alta/Snowbird:
|
alta snow |
Nov. |
Dec. |
Jan. |
Feb. |
Mar. |
Apr. |
max
base |
||
|
60-61 |
75.00 |
40.00 |
1.00 |
62.00 |
113.00 |
35.00 |
326.00 |
||
|
62-63 |
31.00 |
17.00 |
85.00 |
39.00 |
93.00 |
136.00 |
401.00 |
||
|
76-77 |
13.50 |
17.00 |
50.50 |
73.50 |
129.00 |
31.00 |
314.50 |
||
|
86-87 |
58.00 |
13.50 |
79.50 |
80.50 |
102.00 |
21.00 |
354.50 |
||
|
11-12 |
58.50 |
20.00 |
70.50 |
79.50 |
80.00 |
64.00 |
372.50 |
96.00 |
|
|
14-15 |
66.50 |
96.00 |
30.50 |
36.50 |
31.50 |
62.50 |
323.50 |
76.00 |
|
|
17-18 |
23.50 |
50.50 |
62.00 |
83.00 |
96.00 |
66.00 |
381.00 |
96.00 |
|
|
25-26 |
14.50 |
45.50 |
69.00 |
72.50 |
51.00 |
54.50 |
307.00 |
85.00 |
|
|
alta open |
15-Dec |
31-Dec |
15-Jan |
31-Jan |
14-Feb |
28-Feb |
15-Mar |
31-Mar |
|
|
11-12 |
50% |
80% |
73% |
95% |
95% |
100% |
100% |
100% |
|
|
14-15 |
95% |
100% |
100% |
100% |
100% |
100% |
100% |
100% |
|
|
17-18 |
35% |
75% |
76% |
95% |
95% |
100% |
100% |
100% |
|
|
25-26 |
25% |
52% |
96% |
97% |
97% |
90% |
95% |
59% |
|
|
bird open |
15-Dec |
31-Dec |
15-Jan |
31-Jan |
14-Feb |
28-Feb |
15-Mar |
31-Mar |
|
|
11-12 |
24% |
50% |
50% |
88% |
90% |
100% |
100% |
100% |
|
|
14-15 |
31% |
90% |
95% |
96% |
95% |
97% |
94% |
94% |
|
|
17-18 |
6% |
23% |
27% |
61% |
82% |
82% |
84% |
88% |
|
|
25-26 |
23% |
33% |
87% |
97% |
93% |
83% |
93% |
60% |
For Alta the
later 4 years snow numbers are from the Collins site, while the earlier ones
are from UDOT near Alta's base. In terms of a slow start 1976-77 is the
standout, and 2017-18 was the slowest of the recent ones. But overall it's a
positive record only exceeded by Targhee. Due to more rugged lower mountain
terrain, Snowbird will consistently lag Alta in getting terrain open in slow
starting seasons. Both areas preserve snow well, so notice negligible decline
in open terrain in 2014-15, which started OK but had near record low snowfalls
in January, February and March. It's quite a statement about the March 2026
heat wave that significant terrain at these areas closed in late March.
Snowbasin:
|
snow |
Nov. |
Dec. |
Jan. |
Feb. |
Mar. |
Apr. |
max
base |
||
|
11-12 |
43.00 |
6.00 |
62.00 |
23.00 |
42.00 |
23.00 |
199.00 |
72.00 |
|
|
14-15 |
23.00 |
53.00 |
18.00 |
14.00 |
27.00 |
31.00 |
166.00 |
56.00 |
|
|
17-18 |
24.00 |
38.00 |
28.00 |
54.00 |
62.00 |
20.00 |
226.00 |
63.00 |
|
|
25-26 |
9.00 |
25.00 |
30.00 |
28.00 |
15.00 |
23.00 |
130.00 |
57.00 |
|
|
open |
15-Dec |
31-Dec |
15-Jan |
31-Jan |
14-Feb |
28-Feb |
15-Mar |
31-Mar |
|
|
11-12 |
30% |
50% |
40% |
93% |
93% |
100% |
100% |
100% |
|
|
14-15 |
8% |
78% |
98% |
99% |
95% |
95% |
95% |
77% |
|
|
17-18 |
9% |
50% |
65% |
90% |
80% |
88% |
97% |
90% |
|
|
25-26 |
18% |
12% |
39% |
63% |
61% |
71% |
65% |
0% |
There is no
snowfall data for the earlier lean seasons in Utah. 2025-26 is by far the worst
for Snowbasin due its lower mountain getting rain several times.
Park City:
|
snow |
Nov. |
Dec. |
Jan. |
Feb. |
Mar. |
Apr. |
max
base |
||
|
76-77 |
6.00 |
6.00 |
25.00 |
55.00 |
48.00 |
5.00 |
145.00 |
||
|
80-81 |
11.00 |
25.00 |
40.00 |
31.00 |
58.00 |
21.00 |
186.00 |
||
|
86-87 |
18.00 |
7.00 |
59.00 |
38.00 |
46.00 |
3.00 |
171.00 |
||
|
11-12 |
42.00 |
21.00 |
39.00 |
43.00 |
44.00 |
22.00 |
211.00 |
63.00 |
|
|
14-15 |
24.00 |
45.00 |
30.00 |
24.00 |
25.00 |
19.00 |
167.00 |
56.00 |
|
|
17-18 |
8.00 |
34.00 |
42.00 |
52.00 |
44.00 |
15.50 |
195.50 |
46.00 |
|
|
21-22 |
13.00 |
66.00 |
22.00 |
10.00 |
17.00 |
20.00 |
148.00 |
50.00 |
|
|
25-26 |
9.00 |
34.00 |
38.00 |
48.00 |
16.00 |
34.00 |
179.00 |
64.00 |
|
|
open |
15-Dec |
31-Dec |
15-Jan |
31-Jan |
14-Feb |
28-Feb |
15-Mar |
31-Mar |
|
|
11-12 |
21% |
48% |
47% |
93% |
93% |
97% |
93% |
84% |
|
|
14-15 |
9% |
72% |
89% |
94% |
90% |
87% |
88% |
46% |
|
|
17-18 |
6% |
18% |
28% |
60% |
59% |
81% |
79% |
75% |
|
|
21-22 |
7% |
54% |
83% |
92% |
87% |
86% |
85% |
50% |
|
|
25-26 |
3% |
14% |
50% |
65% |
61% |
66% |
52% |
0% |
2017-18 is
the worst recent early season in terms of open terrain, but by snowfall 1980-81
looks comparable and 1976-77 worse. Open terrain declines late in several of
the recent lean seasons, but only in 2025-26 was there a complete wipeout by
the end of March.
Summary:
1976-77
remains the clear cut worst, with Alta snowfall through December being 30.5
inches and Park City snowfall through January being 37 inches. All of the
recent bad seasons have those areas at least half open at the end of those
months. While Snowbird was slower opening terrain in 2017-18 than in 2025-26,
the opposite was true for Alta, Park City and Snowbasin. Considering less total
snowfall and the March meltdown, 2025-26 is Utah's second worst season and
2017-18 is third.
Northern
and Central Colorado
This was the
most notorious region in 2025-26, numerous examples here.
Winter
Park:
|
snow |
Nov. |
Dec. |
Jan. |
Feb. |
Mar. |
Apr. |
Max
Base |
||
|
76-77 |
25.00 |
25.00 |
44.50 |
39.50 |
84.50 |
43.50 |
262.00 |
||
|
80-81 |
49.00 |
25.00 |
40.00 |
37.00 |
70.00 |
25.00 |
246.00 |
||
|
86-87 |
56.50 |
29.00 |
53.50 |
33.00 |
53.50 |
18.50 |
244.00 |
||
|
01-02 |
49.70 |
60.50 |
67.70 |
35.70 |
27.10 |
19.80 |
260.50 |
||
|
11-12 |
27.00 |
15.50 |
47.50 |
53.30 |
18.30 |
21.00 |
182.60 |
64.00 |
|
|
25-26* |
19.00 |
42.00 |
43.00 |
26.00 |
35.00 |
25.00 |
190.00 |
51.00 |
|
|
open |
15-Dec |
31-Dec |
15-Jan |
31-Jan |
14-Feb |
28-Feb |
15-Mar |
31-Mar |
|
|
01-02 |
50% |
85% |
90% |
90% |
90% |
90% |
90% |
75% |
|
|
09-10 |
27% |
43% |
83% |
85% |
88% |
92% |
92% |
92% |
|
|
11-12 |
11% |
38% |
62% |
78% |
83% |
89% |
87% |
77% |
|
|
25-26 |
13% |
21% |
44% |
69% |
70% |
77% |
85% |
14% |
The two
recent seasons above are clearly the worst ones. I say 25-26 is the worst
because of slower opening of terrain plus the late March collapse. But note Winter Park's resilience in 1976-77
and 1980-81 vs. most western areas.
A-Basin:
|
snow |
Nov. |
Dec. |
Jan. |
Feb. |
Mar. |
Apr. |
May |
Max
Base |
||
|
80-81 |
24.50 |
64.50 |
26.50 |
52.00 |
||||||
|
86-87 |
41.20 |
19.00 |
49.00 |
16.50 |
51.50 |
23.20 |
11.00 |
211.40 |
||
|
01-02 |
21.10 |
28.50 |
29.70 |
32.10 |
27.60 |
13.00 |
1.00 |
153.00 |
||
|
11-12 |
22.00 |
10.00 |
40.00 |
48.00 |
12.00 |
34.00 |
18.00 |
184.00 |
54.00 |
|
|
25-26 |
18.00 |
28.00 |
32.00 |
30.00 |
21.00 |
17.00 |
146.00 |
46.00 |
||
|
open |
15-Dec |
31-Dec |
15-Jan |
31-Jan |
14-Feb |
28-Feb |
15-Mar |
31-Mar |
10-Apr
|
|
|
01-02 |
0% |
24% |
44% |
67% |
70% |
75% |
78% |
90% |
75% |
|
|
11-12 |
9% |
17% |
17% |
48% |
48% |
67% |
81% |
50% |
33% |
|
|
25-26 |
5% |
6% |
12% |
20% |
34% |
46% |
73% |
10% |
9% |
The open
terrain numbers are clearly worst in 2025-26. Spring 1981 looks pretty good.
There is no data from 1976-77, but all data available from other Front Range
areas suggests that it was no worse than 1980-81.
Copper
Mt.:
|
snow |
Nov. |
Dec. |
Jan. |
Feb. |
Mar. |
Apr. |
Max
Base |
||
|
76-77 |
17.50 |
18.50 |
31.00 |
31.00 |
42.50 |
||||
|
80-81 |
18.50 |
16.00 |
24.50 |
55.50 |
|||||
|
86-87 |
30.00 |
15.20 |
46.00 |
24.50 |
39.00 |
27.00 |
181.70 |
||
|
11-12 |
26.00 |
12.00 |
49.00 |
53.00 |
10.00 |
18.00 |
168.00 |
63.00 |
|
|
25-26 |
14.00 |
41.00 |
31.00 |
30.00 |
25.00 |
22.00 |
163.00 |
48.00 |
|
|
open |
15-Dec |
31-Dec |
15-Jan |
31-Jan |
14-Feb |
28-Feb |
15-Mar |
31-Mar |
|
|
11-12 |
21% |
31% |
38% |
61% |
67% |
81% |
92% |
80% |
57% |
|
25-26 |
11% |
16% |
49% |
57% |
62% |
80% |
95% |
34% |
30% |
Here the
data is less conclusive. 25-26 is similar to 11-12 mid-season but worse early
and late. But look at Dec/Jan in 76-77 and 80-81 and we know the missing
Novembers didn't have much snow. In that pre-snowmaking era, Copper might be
one of those places that did not open until February.
Vail:
|
snow |
Nov. |
Dec. |
Jan. |
Feb. |
Mar. |
Apr. |
Max
Base |
||
|
76-77 |
36.50 |
32.00 |
64.00 |
||||||
|
80-81 |
17.50 |
15.50 |
35.50 |
65.30 |
|||||
|
11-12 |
38.00 |
20.00 |
58.00 |
54.00 |
25.00 |
16.00 |
211.00 |
47.00 |
|
|
17-18 |
14.00 |
26.50 |
38.00 |
48.50 |
33.75 |
54.75 |
215.50 |
82.00 |
|
|
25-26 |
6.00 |
43.00 |
37.00 |
36.00 |
25.00 |
12.00 |
159.00 |
52.00 |
|
|
open |
15-Dec |
31-Dec |
15-Jan |
31-Jan |
14-Feb |
28-Feb |
15-Mar |
31-Mar |
|
|
11-12 |
27% |
29% |
30% |
84% |
97% |
98% |
98% |
48% |
|
|
17-18 |
6% |
23% |
71% |
90% |
96% |
100% |
100% |
97% |
|
|
25-26 |
17% |
25% |
34% |
34% |
53% |
58% |
68% |
12% |
2025-26 is
clear cut the worst among the recent seasons. For the earlier ones we know the
missing months are lean as at Copper, but in both cases the March snow probably
salvaged the late season.
Steamboat:
|
snow |
Nov. |
Dec. |
Jan. |
Feb. |
Mar. |
Apr. |
Max
Base |
|
|
80-81 |
10.00 |
30.00 |
17.00 |
50.75 |
53.50 |
11.00 |
172.25 |
|
|
86-87 |
49.00 |
16.75 |
54.50 |
39.50 |
43.75 |
19.50 |
223.00 |
|
|
11-12 |
38.50 |
24.50 |
39.00 |
93.00 |
21.00 |
27.00 |
243.00 |
62.00 |
|
14-15 |
57.50 |
56.00 |
11.00 |
58.00 |
30.25 |
24.00 |
236.75 |
60.00 |
|
25-26 |
4.50 |
46.50 |
49.50 |
40.25 |
14.50 |
33.00 |
188.25 |
38.00 |
|
open |
15-Dec |
31-Dec |
15-Jan |
31-Jan |
14-Feb |
28-Feb |
15-Mar |
31-Mar |
|
11-12 |
33% |
61% |
69% |
96% |
97% |
100% |
100% |
81% |
|
14-15 |
30% |
98% |
99% |
98% |
100% |
100% |
100% |
83% |
|
25-26 |
11% |
25% |
61% |
75% |
73% |
77% |
65% |
12% |
2025-26 is
clear cut the worst among the recent seasons, but not quite as bad as at
Vail. I say 1980-81 was worse due to
the prolonged dry start. There is no
data for 1976-77 but from other regional areas it’s likely January was not as
dry as 1981. It’s a close call between
the severely dry Nov-Dec 1976 vs. the March meltdown of 2026 for second place.
Summary:
2025-26 is
one of about 4-5 seasons with the lowest early season snowfall. But it was the
warmest of those, and there is no precedent for a Colorado snowpack being
decimated as severely in March as in 2025-26. The prior benchmark 1976-77 and
1980-81 seasons had adequate March snowfall for decent late season skiing, but
are still roughly tied for second place as worst seasons for the region.
Western
Colorado and Southwest
Moving west
in Colorado, the data from the earlier seasons is sketchy. Accordingly I
compare two independent weather sites to ski areas not too far away that are
75-80% correlated.
Gothic and Aspen:
|
Gothic |
Nov. |
Dec. |
Jan. |
Feb. |
Mar. |
Apr. |
Max
Base |
||
|
76-77 |
22.50 |
7.00 |
35.00 |
26.50 |
41.00 |
30.50 |
162.50 |
24.20 |
|
|
80-81 |
22.00 |
28.50 |
19.00 |
21.50 |
55.50 |
28.00 |
174.50 |
27.80 |
|
|
11-12 |
39.00 |
14.00 |
67.00 |
64.00 |
15.00 |
23.00 |
222.00 |
40.90 |
|
|
17-18 |
22.00 |
21.70 |
29.90 |
44.50 |
22.00 |
29.90 |
170.00 |
36.60 |
|
|
25-26 |
8.50 |
39.50 |
31.00 |
31.00 |
22.00 |
27.00 |
159.00 |
35.80 |
|
|
Aspen |
15-Dec |
31-Dec |
15-Jan |
31-Jan |
14-Feb |
28-Feb |
15-Mar |
31-Mar |
|
|
11-12 |
48% |
65% |
72% |
88% |
94% |
98% |
100% |
78% |
52.00 |
|
17-18 |
13% |
34% |
53% |
67% |
72% |
98% |
100% |
98% |
58.00 |
|
25-26 |
14% |
42% |
82% |
84% |
87% |
92% |
84% |
29% |
42.00 |
Aspen did
better with open terrain in 2025-26 than any of the areas I examined farther
east in Colorado. I say both 1976-77 and 1980-81 were worse. Look at those
meager maximum base depths and the first 4 months of snowfall at Gothic.
Red Mt.
Pass and Telluride:
|
Red Mt. Pass |
Nov. |
Dec. |
Jan. |
Feb. |
Mar. |
Apr. |
Max
Base |
||
|
76-77 |
17.50 |
5.50 |
37.50 |
30.50 |
24.50 |
||||
|
80-81 |
19.00 |
21.00 |
12.00 |
77.00 |
17.20 |
||||
|
17-18 |
7.50 |
9.50 |
57.50 |
66.00 |
26.00 |
25.00 |
191.50 |
||
|
25-26 |
19.00 |
34.00 |
42.00 |
43.00 |
7.50 |
45.00 |
190.50 |
||
|
Telluride |
15-Dec |
31-Dec |
15-Jan |
31-Jan |
14-Feb |
28-Feb |
15-Mar |
31-Mar |
|
|
17-18 |
7% |
11% |
19% |
51% |
64% |
79% |
76% |
71% |
45.00 |
|
25-26 |
5% |
13% |
52% |
83% |
83% |
84% |
81% |
23% |
41.00 |
2017-18 was
worst for open terrain with the dreadful Nov/Dec. I'd guess that 1976-77 was a
similar start and worst overall. If April 1977 was as much as average at Red
Mt. Pass (which it was not at Gothic or Taos), 1976-77 would still be its
driest season by a considerable margin.
Taos:
|
snow |
Nov. |
Dec. |
Jan. |
Feb. |
Mar. |
Apr. |
Max
Base |
||
|
76-77 |
30.00 |
22.00 |
52.00 |
19.00 |
19.00 |
4.00 |
146.00 |
||
|
80-81 |
42.00 |
5.00 |
16.00 |
3.50 |
53.50 |
20.00 |
140.00 |
||
|
01-02 |
31.00 |
48.00 |
36.00 |
16.50 |
14.00 |
1.00 |
146.50 |
||
|
05-06 |
16.00 |
8.00 |
24.00 |
9.00 |
85.00 |
10.00 |
152.00 |
53.50 |
|
|
17-18 |
10.00 |
7.00 |
16.25 |
33.00 |
15.25 |
10.50 |
92.00 |
23.00 |
|
|
24-25 |
33.00 |
3.50 |
26.25 |
9.00 |
26.50 |
14.00 |
112.25 |
41.00 |
|
|
25-26 |
9.75 |
17.00 |
24.60 |
22.50 |
0.50 |
18.00 |
92.35 |
35.00 |
|
|
open |
15-Dec |
31-Dec |
15-Jan |
31-Jan |
14-Feb |
28-Feb |
15-Mar |
31-Mar |
|
|
05-06 |
10% |
25% |
28% |
50% |
60% |
50% |
90% |
90% |
|
|
17-18 |
8% |
12% |
16% |
23% |
25% |
44% |
41% |
41% |
|
|
24-25 |
17% |
21% |
38% |
58% |
58% |
64% |
75% |
46% |
|
|
25-26 |
13% |
17% |
49% |
76% |
80% |
75% |
70% |
0% |
By all
measures 2017-18 is clearly Taos' worst season. Why was this year better with
similar snowfall? I'd speculate that the snow had more water content as
evidenced by the higher max base depth. 1976-77 and 1980-81 weren't good but
they were not as severe as at many places.
Summary
The 2025-26
snowfall pattern was similar to Front Range Colorado, but Aspen and Telluride
got slightly more terrain open than most of the Front Range areas. These areas
were slower getting terrain open in 2017-18, offset by the March meltdown in
2025-26. By contrast, 1976-77 and 1980-81 were more severely dry, both managing
around 90 inches of snow through the end of February at Gothic and Red Mt.
Pass, which usually get a little more snow than the nearby ski areas. So for
this region, 1976-77 is worst, 1980-81 second (more March snow than 1976-77),
2017-18 and 2025-26 tied for third.
Taos has had
5 seasons with 72 inches or less of snowfall through the end of February.
2005-06 was the lowest of these at 57 inches but it had a big March. In terms
of open terrain, 2017-18 is clear cut the worst season. The other three,
2005-06, 2024-25, and 2025-26 are similar, and by snowfall pattern 1980-81
belongs in that group too.