El Nino/La Nina Defined and Ski Areas Favored by El Nino (as of 2026)
|
The El
Nino/Southern Oscillation (ENSO) has been studied extensively for
its impacts upon climate. The shorthand definition of El Nino
is an abnormal warming of the normally cold ocean waters of the
Humboldt Current off the coast of Peru.
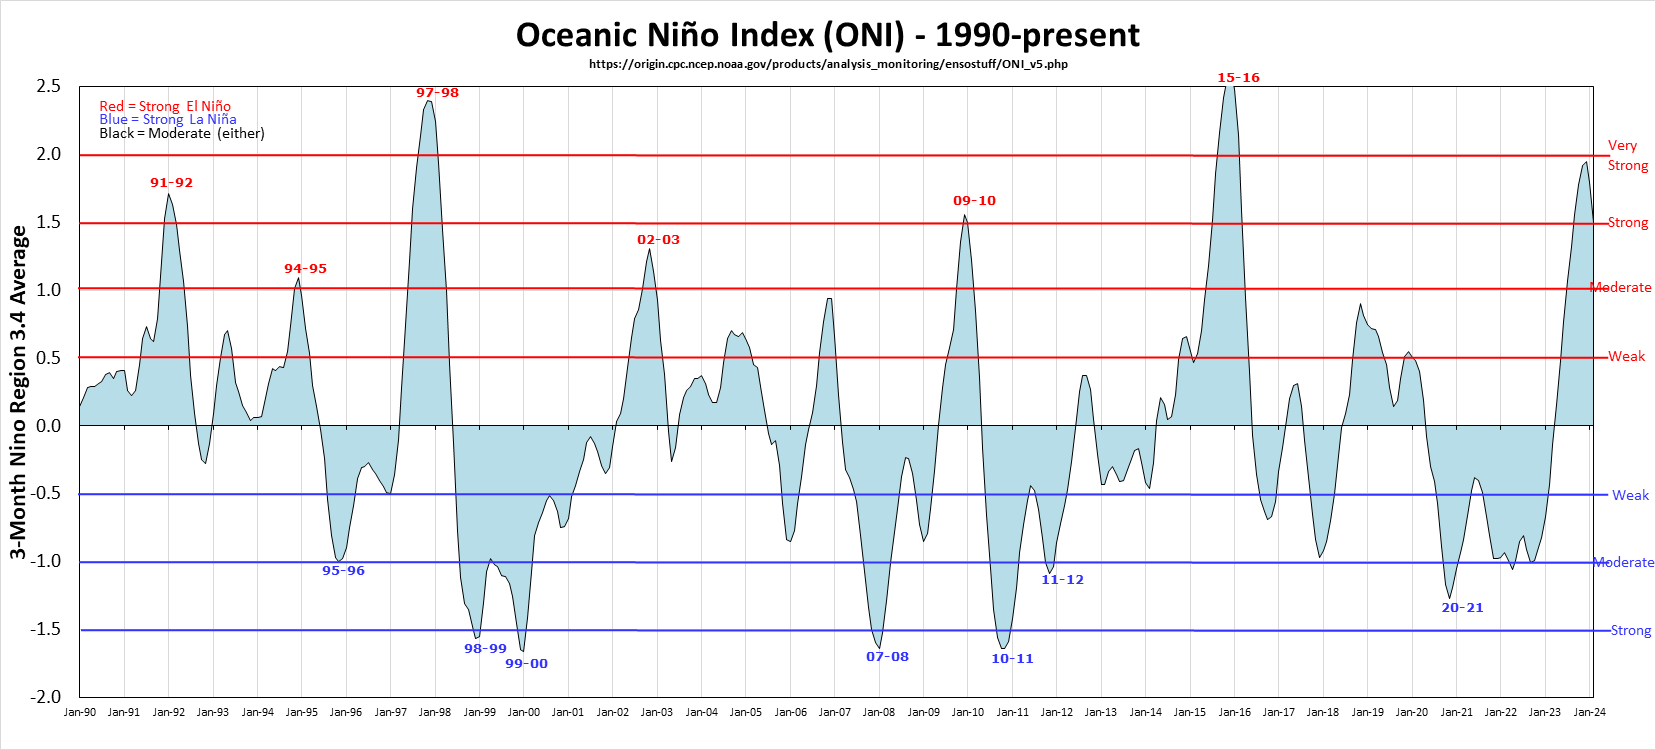
The Oceanic Nino
Index tracks equatorial sea temperatures
between 120 and 170 west longitudes, graphed below since 1990:
As most of us have observed, skilled weather forecasting has become very accurate in the short term, very useful for storm-chasing 3-5 days out, but more speculative beyond a week. Beyond 2 weeks I find it more useful to rely on historical records. El Nino/La Nina is the exception to this rule of thumb because the condition tends to persist for several months at a time. I have examined the monthly MEI table and the monthly ONI table , which both date to 1950. With over 800 monthly values since 1950, each month's indices can be correlated with the index 1, 2, 3, etc. months in the future to demonstrate how likely an El Nino or La Nina condition might persist. Results are shown here:
Notice that there is a very mild
tendency for El Nino/La Nina to reverse itself 14-30 months in the
future (think of a bathtub sloshing one side to the other), and
only after 3 years do all effects of prior conditions disappear.
This pattern and overall level of persistence is similar with both the MEI and ONI indicies.
When I first wrote this article on 11/21/07 the last posted value of MEI was
-1.117 for SEP/OCT 2007 (also -1.1 for ASO ONI), and I expressed strong confidence
that the observed La Nina condition would be in effect through the
end of 2007, and some confidence that it would persist for the
entire 2007-08 ski season. It turned out that La Nina remained strong (2007-08 was 5th
highest La Nina by MEI and 3rd highest by ONI in the past 50 years) through FEB/MAR, then
dissipated to near neutral by MAY/JUN for MEI and a couple months later for ONI.
Similarly the El Nino of 2009-10 was strong
through March, and the La Nina of 2010-11 remained strong through April.
La Nina strengthened to a moderate level by fall 2011 and gradually weakened the following spring.
The MEI and ONI indicies did not have a sustained significant El Nino or La Nina stretch for the
next 3 ski seasons. From late spring 2015 to early spring 2016 El Nino exceeded +2.0 for 9 months
by MEI and 6 months by ONI and ended abruptly in June 2016. There were no material El Nino or
La Nina deviations in the MEI or ONI indices from 2017-2020, so I did not update the data presented
here until after the moderate La Nina of 2020-21. That La Nina persisted for 3 seasons into early 2023.
The ensuing 2023-24 El Nino topped out at +2.0 by ONI and weakened by June. The northern spring months
are the historically most likely time for an El Nino or La Nina to break up, as occurred for all 7 events
from 2007-2024.
The 2024-25 and 2025-26 seasons were close to neutral, but since April 2026 there has been much media hype of
an upcoming strong El Nino. The whole point of El Nino as a weather predictor is that it tends to be stable
from about August to February. Since the northern spring is when El Nino is least stable, I have historically
been skeptical of early predictions. However the history does show a "momentum" factor. The ONI Index has
moved from -0.4 in February 2026 to +0.5 in May. The other comparably large moves (at least +0.8) from negative
to positive in this February to May timeframe were in 1957, 1965, 1972, 1997 and 2023. The ensuing December
ONI values were +1.5, +2.0, +2.1, +2.4 and +2.0. So yes I'm inclined to believe the predictions this time.
What about the other two strong El Ninos? The Feb.- May move in 1982 was +0.5 and the 2015-16 El Nino was
the stronger half of a rare two year El Nino. Multiyear La Ninas are much more common, so a spring "momentum
factor" is less often a leading indicator for La Nina.
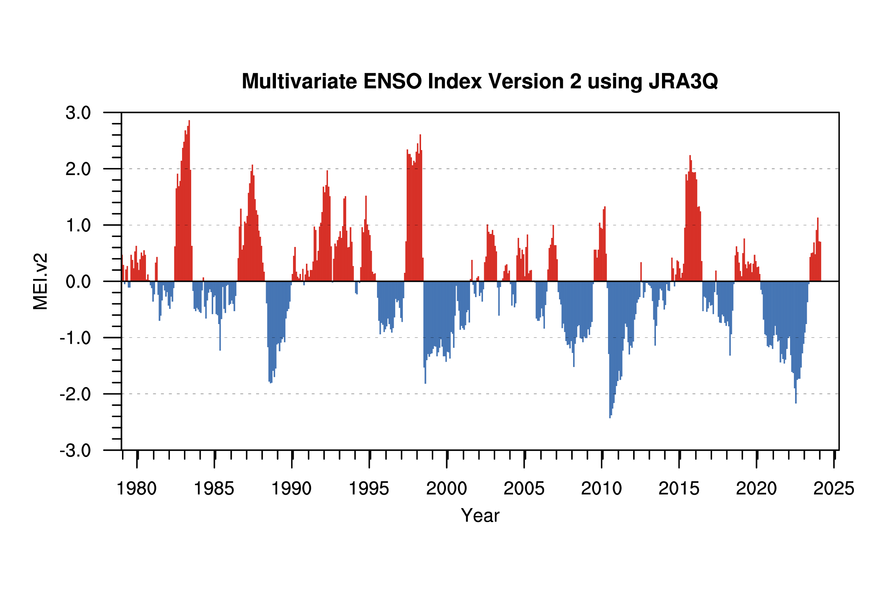
The original MEI index came to an end in
OCT/NOV 2018. The MEI graph at the top of this page is the new MEI.v2 from 1979 to JAN/FEB 2024.
The two MEI indices are calculated differently but are 95% correlated. In
recent years most meteorologists are using the ONI, so I'm doing that too as of 2023. Since 1950
monthly ONI is 88% correlated to monthly MEI and ski season values are 94% correlated, though the
indicies have diveraged since mid-2021 (MEI averaging 0.68 lower than ONI despite no sustained
differences before then). The relationship of ski area snowfall to El Nino/La Nina is still very
similar for both MEI and ONI, as illustrated in the short tables of El Nino favored areas below.
I show only one longer table based upon ONI on my
Ski Areas Favored by La Nina and
Ski Areas Indifferent to El Nino/La Nina webpages.
I had noticed anecdotally that the larger El Nino and La Nina episodes tend
to break up most often during the Northern spring. So tested by each calendar month
the correlations 1 month and 6 months into the future. The one month correlations
are all over 90% but they are highest between July and January. The 6 month
correlations are more revealing. An August or September reading of either MEI or ONI,
available in early September or October, has an 80+% correlation with what we'll have
during the middle of the upcoming Northern Hemisphere ski season. For South America
this has much less predictive value, as El Nino/La Nina during their ski season has
less than 20% correlation with its status 6 months prior. While we have
established that El Nino/La Nina are persistent weather events,
their effects upon ski area snowfall are less clear-cut. I
have correlated the monthly MEI table and the
monthly ONI table
with all of the monthly snowfall data I have collected through 2023,
and the list of ski areas with statistically significant snowfall
sensitivity to El Nino/La Nina is much shorter than most people
think. The monthly
correlations are not large enough to have much predictive value.
But by combining 6 consecutive months together to form seasonal
data, the correlations for some areas get into the 50% range. This
fits with observed experience that in big El Nino or La Nina years
the expected effects occur from time to time but not consistently.
So I considered the seasonal correlations to be the main criteria
in classifying areas. Not all areas provide complete November to
April data, and I like to have 20+ seasons to draw
conclusions. For areas
without enough complete seasons I looked at the monthly
correlations, but also at the seasonal ones for nearby areas with
many complete seasons. For example Sugar Bowl is likely to be
affected similarly to nearby Donner Summit and Alpine
Meadows. It is important to realize that season correlations
based upon 22-70 data points have much more uncertainty than the El
Nino/La Nina persistence correlations based upon over 700 data
points. Correlations are not
necessarily the best way to analyze El Nino/La Nina. Many meteorologists
believe that only the stronger episodes have a material impact. Thus we
should only examine snowfall during the months with the highest and lowest
MEI readings. I chose months above +.700 for El Nino and below -.700 for
La Nina. The problem here is that when I first collected this data in 2007
there had been only 3 La Nina seasons in the past 30 years, and only a few
areas had data from the La Ninas of the early and mid-1970's. Since the 2
strong La Ninas of 2007-08 and 2010-11 there is now more data, so I've revised
my tables to show snowfall percents of normal for strong El Nino months and
strong La Nina months. These columns are blank for areas with less than 22
months of data, which at a minimum would be all La Nina months December-March
from 1988-2021. The list of ski
areas favored by El Nino, along with their monthly and season
correlations to the MEI index and ONI index and average snowfall during strong
El Nino and La Nina months, is shown below:
El Nino
strongly favors only Southern California, Arizona and southern New Mexico,
with milder effects extending to the southern Sierra, far southern Utah
and northern New Mexico. In El Nino years the only big destination resort
that is favored is Taos, and that in the
mild category. Taos takes until nearly February to get
fully covered in normal years, and skiers should be more wary
during La Nina years. The Ski Apache data is derived from SNOTEL water
content but so extreme as to be worthy of inclusion. At its inland 33 degree
latitude there is normally more precipitation in summer than winter and La Nina
winters are almost guaranteed to be extremely dry.
The data I acquired for Las Lenas in
2005 and Portillo in 2007 support the prevailing view that the high
Andes are strongly favored by El Nino. As the 2010-11 La Nina strenghtened
these areas received almost no snow after August 1, 2010.
Advance bookings to these lower latitude South American ski areas
(also the Valle Nevado group) should be avoided in La Nina years
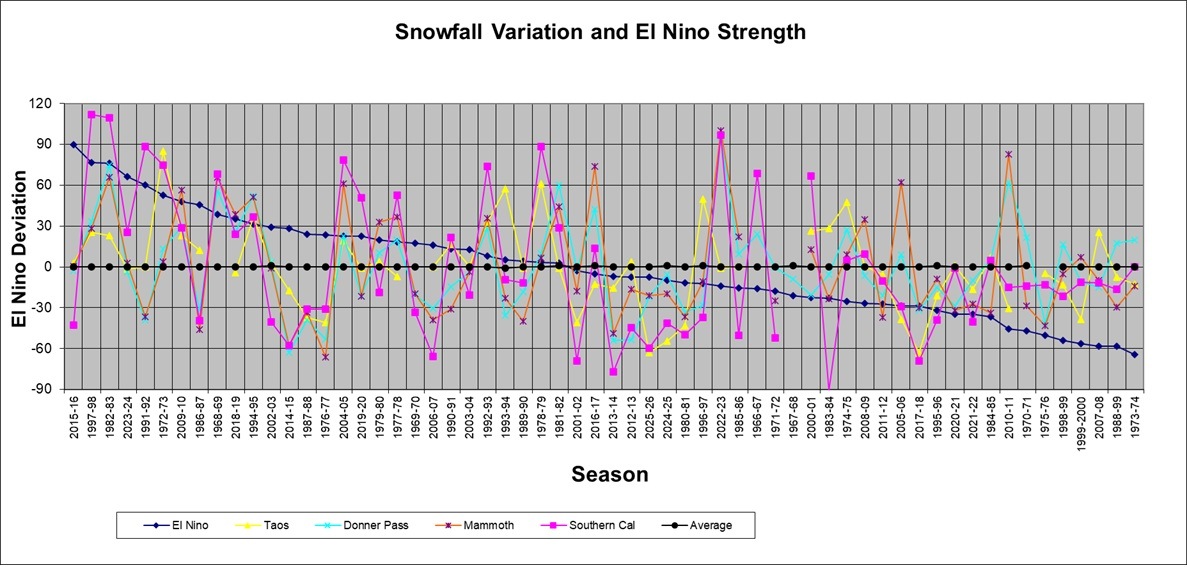
until snow is on the ground. I have
constructed graphs to illustrate the variability of the
snowfall correlations to El Nino/La Nina. The one below is
for selected areas favorable to El Nino. Since 2 of the
strongest La Nina years were 1973-74 and 1970-71, I select areas
with data that goes back that far. The horizontal
axis lists the ski seasons since 1966-67 in order of strong El Nino at
left to strong La Nina at right according to ONI. The vertical axis
is percent deviation from normal snowfall. The blue line is the sum
of ONI indices from OND to MAM, scaled to fit the
graph. The purple line
shows the dramatic boost to Southern California snowfall from El
Nino, with the 2 biggest snow years correponding to the 2 big El
Ninos of 1982-83 and 1997-98. 5 of the top 9 El Ninos produced
at least 170% of normal snow. There are no guarantees even
here, as the #1 and #5 seasons 2015-16 and 1986-87 were real stinkers at only
59% and 62%. Of the top 10 La Nina seasons only 2010-11 was above
average in Southern California, though only one was lower than 77%. Moving to Taos
(yellow line) the effect is less dramatic. The 1983 and 1986 El Ninos
were 116% and 118% of average, while Taos' record 1972-73
season at 174% was in the 5th highest El Nino year.
2023-24, 2015-16 and 1991-92 of the top 8 EL Nino years were below average at
Taos, but those were still at least 95% of average. For the top 9 La
Nina years, Taos is missing data for 1970-71 and 2007-08 was above average.
1999-2000 and 2010-11 were bad at 58% and 65%, and the other 4 were below
average in the 85% range. In the Sierra
the picture is mixed. Everyone remembers the huge Sierra
snow during the El Ninos of 1982-83 and 1997-98. But the 4rd and 5th
strongest El Ninos (1991-92 and 1986-87) were severe drought years
at Tahoe, and 1986-87 was Mammoth's 4th worst season ever at
55%. Nonetheless 7 of the top 13 El Nino years (1968-69, 1982-83,
1992-93, 1994-95, 1997-98, 2009-10 and 2018-19) were at least 130% at Mammoth (orange
line) and at Donner Summit (light blue line) and Lake Tahoe. At Donner Summit
3 of the top 4 La Ninas and 5 of the top 8 are above average. Lake Tahoe
La Nina seasons are probably assisted by colder temperatures
minimizing low elevation rain. This relatively good La Nina
track record is the reason that the MEI correlations are low and
statistically insignificant for areas like Kirkwood, Squaw Valley
and Alpine Meadows.
Historically Mammoth is classified with Taos in
mildly favored by El Nino category. Before 2010, 10 of the top 11 La Nina seasons
were all below average, 5 of them by 30% or more. However Mammoth set a
40+ year snowfall record during the strong La Nina of 2010-11, lowering its
seasonal correlation with MEI from 28.6% to 17.9%. Mammoth's near average snowfall
during the strong El Nino of 2015-16 further lowered seasonal correlation to 16.3%,
and finally another record high season during 2022-23 lowered the MEI correlation
to 13.9%. Bear Valley has a similar weak correlation to El Nino as Mammoth. As of 2023
Mammoth and Bear Valley average 98% and 96% of normal snow in MEI defined strong La Nina months,
which could move those two areas to neutral overall vs. El Nino/La Nina. For the time
being I've left these areas in the mild El Nino favored group due to the spread between
strong El Nino and La Nina months being 13-17% according to the ONI. |
||||||||||||||||||||||||||||||||||||||||||||||||||||||||||||||||||||||||||||||||||||||||||||||||||||||||||||||||||||||||||||||||||||||||||||||||||||||||||||||||||||||||||||||||||||||||||||||||||||||||||||||||||||||||||||||||||||||||||||||||||||||||||||||||||||||||||||||||||||||||||||||||||||||||||||||||||||||||||||||||||||||||||||||||||||||||||||||||||||||||||||||||||||||||||||||||||||||||||||||||||||||||||||