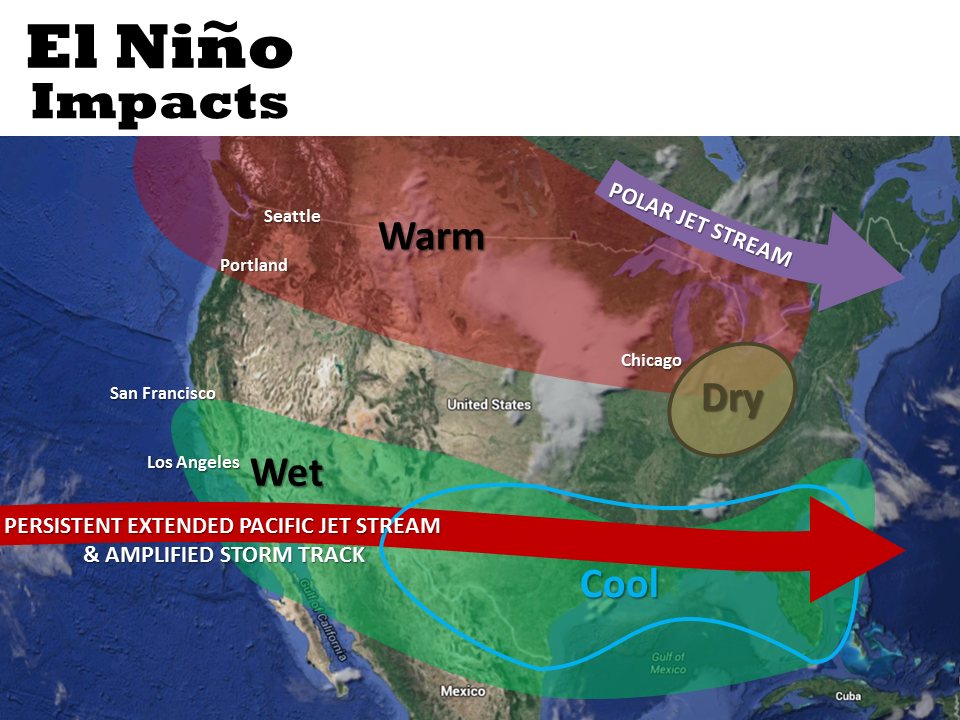
The map above is what many meteorologists expected in 2015-16, but it was far from what actually happened.
The El Nino/Southern Oscillation (ENSO) has been studied extensively for its impacts upon climate. The shorthand definition of El Nino is an abnormal warming of the normally cold ocean waters of the Humboldt Current off the coast of Peru. A more formal measure used by many meteorologists is The Multivariate ENSO Index, which tracks both sea and air temperatures along with wind, pressure and cloud cover across the tropical Pacific. The data is combined and normalized to a monthly value where +1 = one standard deviation above normal (El Nino condition) and -1 = one standard deviation below normal (La Nina condition). I'll refer from now on to the MEI index, which is graphed below since 1950:
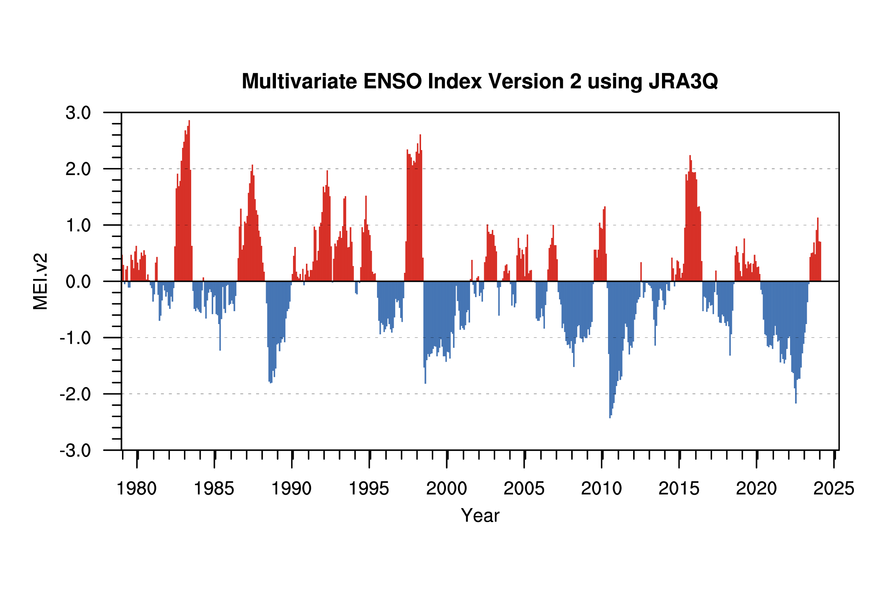
The 2015-16 El Nino was the third strongest on record as can be seen in the above graph.
The list of ski areas favored by El Nino is a short one, but in both North and South America the impact upon ski areas in the 33-35 latitude range in both North and South America was impressive during historical El Nino months (MEI>0.75) and particularly during the 3 strongest El Nino seasons before 2015-16. For South America 1982, 1997 and 2015 were also strong El Ninos as the events got under way by May or June. The North American 1991-92 El Nino started later in 1991, so the right column* for South America* refers to its second strongest El Nino in 1987.
| Area/Season | All | 1982-83 | 1997-98 | 2015-16 | 1991-92* |
| Average MEI Index, Listed Ski Season: | El Nino | +2.808 | +2.515 | +2.119 | +1.706 |
| Months | |||||
| Strongly favored by El Nino | |||||
| Arizona Snowbowl 1, Ariz. 9,500 | 128% | 128% | 137% | 160% | |
| *Portillo, Chile 9,400 | 123% | 144% | 196% | 74% | 101% |
| *Las Lenas, Argentina 7,400 | 124% | 145% | 70% | 147% | |
| Southern California Composite 7,000 - 8,000 | 125% | 216% | 218% | 59% | 194% |
| Arizona Snowbowl 2, Ariz. 10,800 | 122% | 116% | 133% | 78% | 154% |
| Average | 124% | 151% | 166% | 70% | 151% |
| Mildly favored by El Nino | |||||
| Brian Head, Utah 9,770 | 118% | 141% | 96% | 96% | |
| Thompson Pass (Chugach), Alaska 2,450 | 116% | 84% | 171% | ||
| Taos, N. Mex. 11,200 | 113% | 117% | 120% | 98% | 95% |
| Bear Valley, Calif. 7,750 | 114% | 182% | 160% | 67% | |
| Mammoth Mtn, Calif. 9,600 or 8,900 | 113% | 169% | 131% | 102% | 64% |
Given the huge snowfalls in the prior strongest El Nino seasons, it was a shock to see 2015-16 come up much drier than normal in Southern California/Arizona and also 2015 in the northern Andes. It was not completely unprecedented as 1986-87, fifth strongest El Nino, was also a low snow year in Southern California, though not in Arizona or the northern Andes. The mildly favored resorts in New Mexico and the southern Sierra Nevada of California had near average seasons in 2015-16. The Sierra, like Southern California was poor in 1986-87, but also in 1991-92. 1991-92 was characterized by a persistent split jet stream, which forced most storms either north through Alaska or south through Southern California and Arizona, with regions in between suffering extreme drought. Those southern regions actually got more snow than the Utah Wasatch in 1991-92. The list of resorts favored by La Nina is much longer, encompassing much of the Pacific Northwest, western Canada and the US Northern Rockies. Prior El Nino months were overall not as negative for these areas (84% of normal) as they were positive for the favored areas (124%). Also the strongest El Nino years were not necessarily more negative for these areas in contrast to snowfall being at its very highest in the strongest El Nino years for the low latitude areas. Notably the high El Nino snowfall of 1982-83 extended as far north as Oregon and Idaho. The split jet stream season 1991-92 was by far the worst El Nino for these areas.
| Area/Season | All | 1982-83 | 1997-98 | 2015-16 | 1991-92* |
| Average MEI Index, Listed Ski Season: | El Nino | +2.808 | +2.515 | +2.119 | +1.706 |
| Months | |||||
| Strongly favored by La Nina | |||||
| Big Mountain, Mont. 6,700 | 75% | 98% | 58% | ||
| Snoqualmie Pass, Wash. 3,000 | 79% | 83% | 93% | 104% | 53% |
| Mt. Baker, Wash. 4,300 | 87% | 101% | 97% | 58% | |
| Fernie, B. C. 5,400 | 79% | 98% | 85% | 69% | |
| Mt. Hood Meadows, Ore. 5,400 | 81% | 99% | 106% | 52% | |
| Jackson Hole, Wyo. 8,250 | 91% | 97% | 94% | 86% | 74% |
| Sunshine Village, Alb. 7,028 | 87% | 73% | 69% | 99% | 83% |
| Mt. Fidelity (Selkirks), B. C. 6,150 | 89% | 85% | 74% | 87% | 96% |
| Mt. Rainier Paradise, Wash. 5,420 | 86% | 93% | 99% | 112% | 71% |
| Whistler Base, B. C. 2,200 | 83% | 67% | 67% | 68% | |
| Steamboat, Colo. 9,200 | 87% | 63% | 88% | 110% | 79% |
| Schweitzer, Idaho 4,700 | 86% | 67% | 97% | 100% | 72% |
| Bridger Bowl, Mont. 7,100 | 86% | 82% | 94% | 89% | 47% |
| Mt. Bachelor, Ore. 6,350 | 90% | 141% | 83% | 107% | 58% |
| Cannon Mt., N. H. 1,800 | 86% | 70% | 47% | 64% | 73% |
| Lake Louise, Alb. 6,700 | 88% | 82% | 74% | 100% | 78% |
| Stevens Pass, Wash. 4,062 | 80% | 84% | 97% | 90% | 52% |
| Mt. Norquay, Alb. 5,350 | 82% | 77% | 55% | ||
| Crystal Mtn 2, Wash. 6,100 | 90% | 107% | 96% | 127% | 50% |
| *Spencer's Creek, Australia 5,903 | 76% | 46% | 76% | 76% | 85% |
| Average | 84% | 82% | 86% | 96% | 67% |
| Mildly favored by La Nina | |||||
| Smuggler's Notch, Vt. 1,600 | 75% | 84% | 50% | 81% | |
| Brundage, Idaho 6,000 | 96% | 131% | 100% | 74% | |
| Snowmass, Colo. 11,000 | 86% | 94% | 53% | ||
| Grand Targhee, Wyo. 8,200 | 96% | 116% | 102% | 86% | 56% |
| Crater Lake (Mt. Bailey), Ore. 6,800 | 95% | 134% | 116% | 106% | 49% |
| Crystal Mtn 1, Wash. 4,400 | 84% | 83% | 98% | 59% | |
| Whitewater, B. C. 5,500 | 93% | 110% | 105% | 108% | |
| Jupiter Bowl, Utah 10,000 | 95% | 81% | 141% | 97% | 72% |
| Jay Peak, Vt. 3,000 | 85% | 77% | 111% | 51% | 117% |
| Big Sky, Mont. 8,920 | 94% | 110% | 97% | 86% | |
| Crested Butte, Colo. 10,150 | 87% | 76% | 87% | 64% | 63% |
| Mansfield Stake, Vt. 3,950 | 86% | 89% | 105% | 43% | 102% |
| Sugarbush, Vt. 3,000 | 75% | 91% | 58% | 77% |
The La Nina strongly favored areas also did not conform to expectations in 2015-16, though the impact was not nearly as extreme in the opposite of expected direction as for the El Nino favored areas. The overall 96% for the strong La Nina areas understates the quality of the 2015-16 ski season in the Northwest and western Canada, as the early season was very strong and the driest month was April, when many of these areas close partway through the month. The Okanagan region of western Canada had the highest relative snowfall of any ski region in North America at about 125%. El Nino is at most a secondary factor for the disastrous 2015-16 season in the Northeast. The El Nino did bring high temperatures, which are never a good thing for Northeast skiing. Nonetheless, some of the Vermont areas listed had average or better seasons in 1991-92 and 1997-98.
I'm not a meteorologist, so I'll defer to a few of them for explanations of what happened during El Nino 2015-16.
Bryan Allegretto at OpenSnow was very cautious last fall about the El Nino hype for the Sierra:
Looking Backward and Forward... He saw too many differences in
various ocean temperatures in November 1997 vs. November 2015 and thus predicted a Sierra season in the 95-110% range, which
turned out to be right on the mark.
At mid-season Seattle meteorologist Cliff Mass defended the forecasts.
Stop the El Nino Forecast Complaints! A
key point is that historically (and certainly in 1982-83 and 1997-98) El Nino effects were strongest in the second half of the
season. El Nino really doesn't prevent the usual pattern of heavy Northwest precipitation November - January. But in 2015-16
the early season Northwest precipitation wasn't just average it was far above average and close to record breaking in
December. However April was record warm and dry in the Northwest and western Canada, a pattern made more likely by the El Nino.
A June post-mortem from Lester Rowntree at U.C. Berkeley:
Lessons From An El Nino That Didn't Go As Planned
For more individual area detail, see:
1982-83 Ski Season Summary
1997-98 Ski Season Summary
2015-16 Ski Season Summary